Author name: Curtis West

Director at Vaxa Analytics

A computer-generated fictional map of train lines, containing colourful lines criss-crossing the page. A red pin clothespin sticks from up from the centre of the paper.

Cracking the Churn Code: Finding Where Churn Originates

The term “churn” often looms large, carrying profound implications for customer relations and profitability. While many discuss its significance, the practical methods to decipher the origins of churn often remain shrouded in secrecy.

At Vaxa Analytics, we believe in transparency and knowledge sharing. In this instalment of our series, we peel back the curtain and unveil our precise methodology for understanding churn dynamics. From deciphering complex graphs to delving into insightful cohort analyses, we guide you step-by-step.

With our approach, demystifying churn becomes not just a theoretical exercise but a tangible, actionable process. We illuminate the path to discern where changes can be made, allowing you to cater to your customers’ needs effectively and precisely when they need it most.

This blog post is part of our Cracking the Churn Code series, part of our Demystifying Analytics program. See our full series here, and keep an eye out as we explore this topic in great detail – but this time, in plain English.

Tracking Churn Over Time: Unraveling Trends

When it comes to understanding any customer behaviour and indeed, business performance, time is the most crucial dimension.

By tracking churn rates over various periods—ranging from monthly to quarterly to yearly—we gain valuable insights into the macro nature of the relationship between your business and your customers.

However, the effectiveness of this analysis heavily depends on the precision and adaptability of the metrics used, as well as the underlying data quality. It’s vital to have a well-calculated metric that can seamlessly adapt to different time periods – there are a lot of definitions to calculate “churn” out there, but we have one that we think is the most robust.

Long-term trends provide a panoramic view of customer loyalty and engagement. By identifying these patterns, such as a gradual increase in churn over several quarters, businesses can strategise for sustainable growth. Sudden fluctuations, on the other hand, demand immediate attention. They could signify external factors like market shifts or internal issues such as service disruptions or customer dissatisfaction.

Don’t forget – even the time of the month can significantly impact churn rates. For instance, customers might be more likely to churn around payment dates or their pay slips.

Time of year also plays a big part—good old-fashioned seasonality.

Consider a gym. By tracking monthly churn rates, the business might notice a spike in cancellations during the winter months — when getting out of bed early becomes harder. This insight could lead to a targeted effort to offer more after-work/weekend classes, bring-a-friend-for-free, or special “pay upfront and save” (aka “lock yourself in”) options. We’ll explore how you might track the effectiveness of this later in the piece.

In another scenario, a corporate-focused SaaS company might observe increased churn around the end of the financial year when budgets are reassessed. Recognising this pattern allows the company to proactively engage with clients, offering tailored solutions or discounts to incentivise renewals well before the year-end budget cuts take effect. Even better if they use other data they have collected (e.g. product analytics) to better demonstrate and reiterate the value their solution provides.

Understanding these time-based patterns helps you anticipate and prepare for fluctuations, enabling proactive retention efforts ahead of these critical periods.

But how do we understand the impact of our retention efforts?

Cohort Analysis: Understanding Where To Play And The Impact of Changes

Cohort analysis allows us to dissect customer data based on specific characteristics or time frames. In most cases, you’ll develop cohorts based on the sign-up date.

By scrutinising these cohorts, your business can gain profound insights into customer behaviour when it comes to their subscriptions; as cohorts are groups of customers who share common traits or experiences within a particular time frame, the analysis speaks directly to the experience of alike customers within those cohorts.

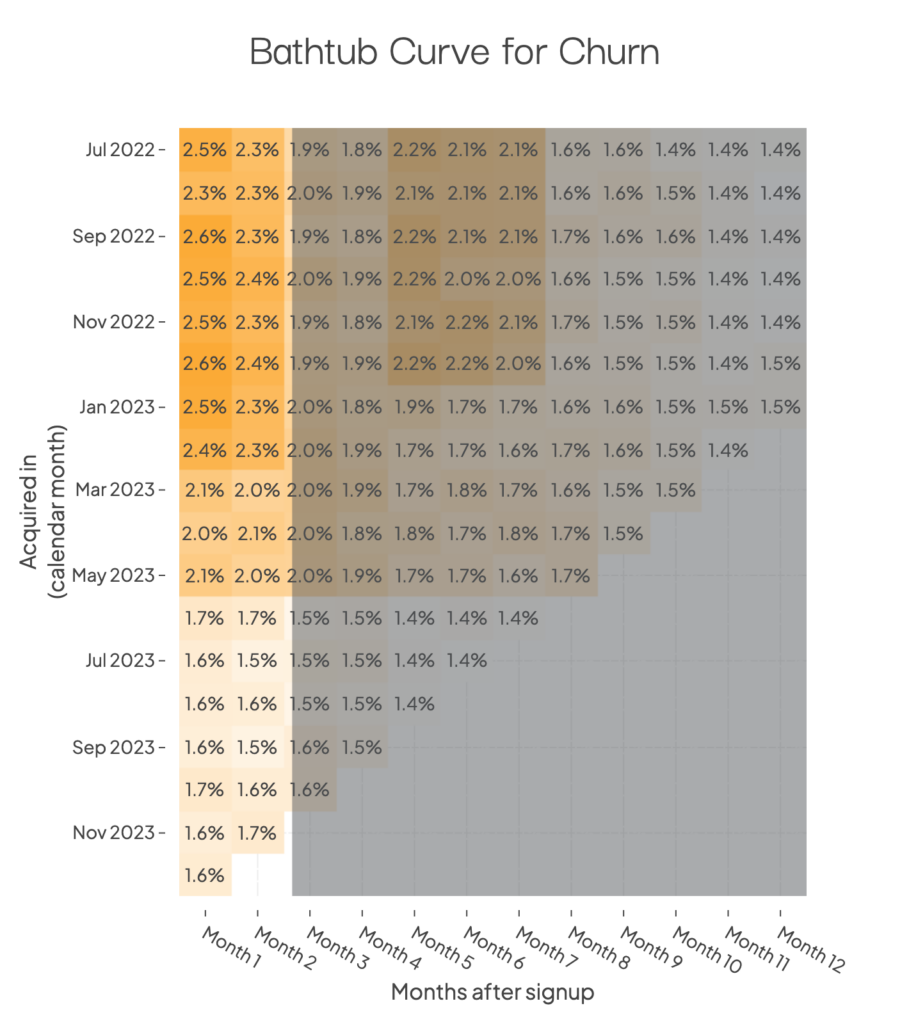
Here’s an example cohort analysis. We’re going to keep on the topic of subscriptions, but the exact same approach can be used for ad-hoc purchases too.

In this case, we’ve created cohorts based on the sign-up date on the Y-axis.

On the X-axis, you’ll note we don’t use calendar months, we use months relative to their signup date. So, 1 month after signup, 2 months after signup. That’s critical to how we use cohort analysis.

Finding Your Key Hurdles

Examining our cohorts “vertically” — picking e.g. Month 3 or Month 4 from the X-axis—we can uncover how our customers perceive value over time. Is month 3 when they start to regret their decision to sign up? Or is it actually Month 6? Can you think of some strategies to address churn—before it happens—at these critical points?

We can also often see the classic bathtub curve in these charts; churn is often higher in the first few months of a subscription, then will stabilise as the remaining subscribers are more committed.

Changing Acquisition Strategies

Lots of subscription businesses will change tact and alter how/where they’re finding customers—often for a good reason. But as we know, acquisition is only half the challenge. Are these “different” subscribers sticking around long enough to make this strategy stack up? That is to say, are we finding the right type of new subscriber?

Cohort analysis can do that, too.

By comparing May with June (when this hypothetical new acquisition strategy started), we can see that yes, our strategy does in fact find subscribers who stick around for long enough. Great!

Tracking Your Impact

You can also use cohorts to understand the real-world impact of your efforts. Let’s say in Jan 2023 we introduced a hyper-targeted retention program for our subscribers reaching the 6-month mark (the hurdle from earlier). Did it make a difference?

Well, we can see that our cohorts who are reaching the 6-month mark after we made this intervention are sticking around for a lot longer — meaning our efforts are working!

The Gold Standard: A/B Testing

Coupled with this standard cohort analysis, A/B testing (where possible) will provide you with a gold-standard method to gauge the impact of your efforts in addressing customer churn.

By comparing two groups—one exposed to a change (e.g., a new pricing tier) and the other kept unchanged—you can quantitatively measure the effect on churn rates, no ifs or buts. This empirical approach offers invaluable insights, enabling data-driven decision-making for effective—both in effort and in cost—churn management strategies.

Cohort analysis, paired with the precision of A/B testing, equips your business with a robust toolkit to not only comprehend the impact of changes but also proactively enhance customer experiences, thereby reducing churn rates and fostering long-term customer relationships.

Our favourite, approachable and free resource for learning all about this approach is The Open Guide to Successful AB Testing by our friends over at Growthbook – a platform we love and use for our client’s AB testing efforts. It’s well worth the read.

Segmentation Insights: Cracking Churn in Customer Groups

Segmentation is the key to so many powerful insights – and customer churn is no exception. By categorising customers into distinct segments based on various criteria such as demographics, behaviour, or preferences, we can conduct targeted analyses that offer deeper insights into customer behaviour.

Understanding how different segments respond to changes not only refines the analysis but also guides our strategy for actions to take, as we can theorise how different segments will respond to different treatments.

Overlaying Segments: Enhancing Sensitivity in Analysis

By simply conducting the exact same analysis we presented above, but just filtered to each of your segments, your analysis gains a whole layer of nuanced depth. It’s particularly powerful when analysing churn.

Treating all customers as a homogeneous group can lead to oversights. Customer behaviours and reasons for churning can vary significantly across different segments. For instance, low-value (low monthly $ value) customers might churn for different reasons than long-term or high-value customers – they’re likely more price-sensitive. By dissecting the customer base into segments, businesses can pinpoint the specific factors influencing churn within each group.

Indeed, in some cases, your overall churn may not exhibit any of the trends we just reviewed above – but by overlaying your segments, this suddenly appears.

That’s why we say overlaying different segments amplifies the sensitivity of churn analysis.

Overlaying different segments amplifies the sensitivity of churn analysis.

By examining churn rates within each segment, businesses can uncover hidden patterns and trends that might remain obscured in broader analyses.

For example, a slight increase in the overall churn rate might not raise concerns, but if this increase is concentrated within a high-value customer segment, it becomes a critical issue that demands immediate attention.

A segment consisting of customers who primarily engage through mobile apps might show different churn behaviours compared to those who use desktop platforms – both due to how they were acquired, but also the experience they have using this different platform.

Linking Segmentation and AB Testing

So we’ve established some customer segments and identified churn that’s specific to some segments and not others.

We start to theorise why Segment X churns more than Segment Y. But how will we know?

To truly understand this, we must back up our segmentation insights with A/B testing. This way we can craft targeted retention strategies that address the unique needs of each segment, and be confident that our efforts are truly driving the result (and not random chance).

This sort of segment-specific A/B testing requires a solid data management framework to ensure you can target the right segment, record which variant each customer is in, and then record the outcomes. We’d be happy to help.

Consider Segment X, comprising price-sensitive customers, and Segment Y, consisting of customers seeking premium services. We’ve built these segments based on a combination of survey data during onboarding, external data enrichment services, and the price plan they selected.

We theorise Segment X responds positively to discounts and special offers, while Segment Y values personalised experiences and exclusive access to premium features. We also theorise that by highlighting these angles to each respective segment, we’ll see a reduction in churn.

A/B testing confirms these insights: Segment X shows increased engagement and reduced churn when offered discounts, whereas Segment Y responds better to personalised loyalty programs and early access to new features.

When our efforts align seamlessly with customer segments, it creates a win-win situation.

Your customers feel valued and understood, leading to increased loyalty and reduced churn. Moreover, your business experiences higher ROI on its retention efforts, as resources are directed precisely where they yield the most impact. This symbiotic relationship between segmentation analysis and A/B testing results in a dynamic, responsive churn management strategy that adapts to the evolving needs of different customer segments.

Navigating The Future: In Conclusion

Understanding churn isn’t just about observing patterns—it’s about deciphering the language of your customers, spoken through their actions and choices. By exploring the intricacies of time-based trends, delving into cohort analyses, and overlaying different customer segments, you gain the power to predict, respond, and ultimately, retain.

The synergy between segmentation analysis and A/B testing presents an opportunity for your business to refine its strategies, reaching customers in the most meaningful ways.

As you embark on your journey to crack the churn code, remember: every churned customer represents not just a loss but an opportunity. An opportunity to learn, adapt, and create an experience so exceptional that it becomes a stronghold against churn’s relentless tide.

Armed with insights, strategies, and an unwavering commitment to customer satisfaction, your business is now better poised to navigate the future with confidence, ensuring lasting relationships and enduring success.

Cracking the Churn Code: Revenue vs Membership Churn

Customer churn is the silent killer of businesses. It’s the phenomenon where customers leave, and revenues dwindle. Understanding churn is crucial, but here’s the catch: there are two types, membership churn and revenue churn. Which one should you focus on? Let’s dissect both to find the answer.

This blog post is part of our Cracking the Churn Code series, part of our Demystifying Analytics program. See our full series here, and keep an eye out as we explore this topic in great detail – but this time, in plain English.

The Churn Dilemma: Membership vs Revenue

In the intricate world of customer analytics, your business may find itself standing at a crossroads, torn between tracking membership churn and revenue churn.

Or worse, not even considering that there’s a choice here.

The choice between these metrics is akin to deciding which lens to view your customer exodus, and each offers a unique perspective. We think one is a clear winner.

See if you can tell which as we go.

Membership churn, the more commonly observed metric, focuses on the sheer number of customers departing from a service or product within a specific timeframe. It appears straightforward, addressing the fundamental question: how many customers are you losing? However, this simplicity is deceptive, as membership churn tends to overlook a critical factor—changes in customer value.

In contrast, revenue churn provides a financially astute viewpoint. By monitoring revenue churn, your business gains insight not only into the quantity but also the quality of lost customers. This metric accounts for the fluctuations in your subscription plans (upgrades, downgrades, payment failures in some cases) encapsulating the shifts in customer spending habits, and ultimately providing a more precise understanding of the financial impact of churn.

The dilemma lies in deciphering which metric aligns best with your business’s approach to managing churn.

Revenue Churn: The True Bottom Line

What sets revenue churn apart and makes it arguably superior to membership churn is its ability to capture the true impact on your business’ bottom line.

By understanding the revenue lost due to customer churn, your business can better make data-driven decisions about addressing churn. This metric illuminates subtle yet crucial details, such as the rate at which higher-value customers are leaving or how pricing adjustments affect customer retention – particularly at those oh-so-valuable higher membership tiers.

Even better, where KPIs and team performance are monitored based on churn, revenue churn will automatically focus their efforts on things that actually affect your bottom line, like increasing efforts towards upgrading members, while also focusing efforts on retention of your higher-value customers.

This depth of insight equips your business not only to stem financial losses but also to craft targeted strategies — and financially sustainable ones at that because you’ll have a direct connection to revenue. This is paramount in ensuring sustainable growth and fostering long-term customer relationships.

In essence, revenue churn guides your business toward the path of financial stability and customer-centric success – rather than just a vanity metric of “we have 100,000 members on our book”.

“Oh yeah, we forgot to mention they’re all $1/mo members”.

And that’s why we think…

Membership Churn Can Be A Deceptive Metric

Membership churn, while seemingly straightforward, often conceals a significant caveat: it doesn’t discriminate between high and low-value customers.

Imagine a scenario where this business boasts proudly of having 100,000 members, only to realise later that they’ve all downgraded to the lowest $1/mo membership.

In the realm of business sustainability, this revelation renders membership churn a deceptive metric. While it might indicate a high volume of users leaving, it fails to reflect the true financial impact, as these departing users weren’t contributing revenue in the first place.

Businesses only operate when they make money — when they have revenue. Not when they have users on the books.

Unless you’re Uber.

That’s why we think membership churn isn’t really the greatest measure when you’re managing churn.

But that’s if you’re considering membership churn on its own. We actually think both should form part of your analytics strategy. Here’s why.

Why Track Both? The Power of Comparison

Comparing these metrics serves as a simple wayfinder to focus your efforts.

For instance, if your business experiences a spike in revenue churn outpacing membership churn, it signifies high-value customers departing. This insight prompts tailored retention efforts, ensuring the business doesn’t lose its financial backbone.

Conversely, if membership churn surpasses revenue churn, it suggests a loss of lower-tier users, which might be less concerning from a revenue perspective — provided this is aligned with your business strategy.

This comparative analysis sharpens decision-making, fostering a balanced approach where customer quantity aligns seamlessly with revenue quality.

In Closing: A Balanced Approach to Churn Management

We’ve explored some of the nuances between revenue churn and membership churn. While membership churn offers a quick pulse on customer departures, revenue churn unveils the financial intricacies, providing invaluable insights into the true health of a business. By embracing both metrics, businesses like yours can craft a balanced approach, addressing both quantity and quality in customer attrition.

The power of comparison cannot be overstated. Recognising that there will be disparities between membership and revenue churn rates serves as an early warning system, alerting your business to potential issues. Whether it’s the departure of high-value customers or a natural shedding of low-revenue generating users, these insights guide us in tailoring their retention strategies effectively.

In essence, successful churn management is much more than mere numerical metrics.

It embodies a holistic understanding, where every lost customer is not just a subtraction from a tally but an opportunity for strategic adaptation. Churn ceases to be a threat; it becomes a catalyst for growth, driving your business towards enduring success and customer-centric excellence.

Connecting analytics with action

Believe it or not, analytics is more than just a sleek report generated at the end of each month. Often, the line connecting analytics with action is overlooked in favour of more shiny, flashy dashboards. What may look like eye candy is distracting you from the prize: growth.

In today’s data-driven world, businesses are constantly collecting data. Yet, many fall into the trap of thinking that having another fancy report will give them the answers they need to achieve business success. But growth only comes from making smart decisions using that data.

Indeed, many of the best insights are so simple, yet influential.

To help you not fall victim to the ‘infographic infatuation’ or the ‘dazzling dashboard dependency’, here are three tips to help you effectively connect your analytics with action:

1. Keep it simple
Businesses often get lost in what data they could be collecting or analysing. They overlook what’s already right in front of them. The key is to keep it simple and focus on what truly matters. Identify the goals and metrics that align with your business objectives. By concentrating your efforts on a few critical data points, you can avoid analysis paralysis and ensure your team is focused on truly actionable insights. Don’t be afraid to pop analysis items in the parking lot.

2. Build a team
As humans, we’re social creatures and often work better in groups. By forming a dedicated team to dissect reports, discuss the implications of the data, and formulate recommendations, you increase the ability to connect your analytics with business goals. Or as we like to think of it uncovering actionable insights and outcomes. A group does this better. They simply see it from more angles.

3. Be ready to act
The most crucial step in the analytics process is acting. Even if your plans are not fully baked, you can always measure the results after. There’s a lot of value in moving quickly, and so rarely are outcomes disastrous. So you’re best to put your hypotheses into market as quickly as possible and measure the outcome. That’s the best data point you can get.

Whilst aesthetically pleasing dashboards can wow over the boardroom on the surface, their true value only lies in their ability to guide your actions and outcomes. By simplifying your focus, encouraging collaboration, and importantly, taking action, you can harness the full potential of your analytics and turn them into the shiniest of actionable insights.

Remember, you don’t need to nail it the first time. Connecting your analytics takes time and practice, but the most important part is maintaining velocity.

Connect your analytics with action today – contact the team at Vaxa Analytics and unlock what you did not know you could.

Spy at work. Man with binoculars.

Your competitors do it to you. Do you?

Your competitors closely analyse your every move. The question is, are you doing the same?

To outperform your rivals, the techniques of yesteryear (reading their catalogue, making a visit in-store) need not apply. Today, data analytics powers competitor analysis. By comprehensively unravelling their strategies, uncovering their strengths and weaknesses, and gaining valuable insights, you can position your business for success in an increasingly competitive environment – particularly as consumer behaviour adapts to tightening wallets.

In this blog post, we will dive into the world of competitor analysis, explore how data analytics can drive your understanding of competitors, and reveal the tools and techniques you can leverage to gain a competitive edge.

The art of competitor analysis

Competitor analysis is not just a buzzword; it is an essential practice for businesses aiming to thrive in a competitive marketplace. Understanding your competitors is like peering through a keyhole into their strategies, strengths, and weaknesses.

It provides you with valuable insights that can inform your own business decisions and help you outperform them.

But how do you approach competitor analysis effectively? Well, it begins with a structured and systematic approach that allows you to dig deep into the market landscape. Our focus isn’t on pure data here. It’s on forming a picture of where we could apply data (which we’ll look at in the next section).

Here are the key elements of successful competitor analysis:

  1. Identifying Your Competitors: Start by identifying your direct and indirect competitors. Direct competitors offer similar products or services, target the same customer segments, and compete directly with you for market share. Indirect competitors might offer substitute products or cater to slightly different customer needs but still pose a competitive threat. Identifying both types will give you a holistic view of the competitive landscape.
  2. Assessing Products and Services: Analyse your competitors’ offerings to understand their unique selling propositions, pricing strategies, product features, and customer value. Look for areas where their offerings differentiate from yours and identify any gaps or opportunities that you can leverage.
  3. Analysing Marketing Strategies: Examine your competitors’ marketing strategies, including their advertising campaigns, social media presence, content marketing efforts, and customer engagement initiatives. Identify the platforms they use, the messaging they employ, and the tactics that seem to be resonating with their target audience. This analysis will help you refine your own marketing approach and identify ways to stand out.
  4. Evaluating Strengths and Weaknesses: Identify your competitors’ strengths and weaknesses by assessing various aspects such as brand reputation, customer satisfaction, market share, distribution channels, and innovation capabilities. Understanding their strengths can help you identify areas where you need to improve while recognising their weaknesses can reveal opportunities for you to capitalise on.

By conducting a comprehensive analysis of your competitors, you gain a clearer understanding of the market dynamics, customer preferences, and emerging trends. This knowledge empowers you to make informed decisions and devise strategies that set you apart from the competition.

We’ll now explore how data analytics can take your competitor analysis efforts to the next level. We will delve into the power of data-driven insights and the tools and techniques available to unlock valuable information about your competitors. So buckle up and get ready to unleash the full potential of competitor analysis with the power of data analytics.

Powering up your competitor intelligence with data analytics

Data analytics is, undoubtedly, a formidable tool for unlocking competitive intelligence.

It enables you to gain valuable insights into their competitors’ strategies, strengths, and weaknesses, empowering them to make informed decisions and outperform their rivals. Let’s dive into this in practice.

  1. Social Media and Review Monitoring: Recent technology developments, including AI-powered sentiment analysis (which we do a lot of here at Vaxa!), enable you to monitor social media and review activity surrounding your competitors. By tracking mentions, growth rates, sentiment, and customer feedback, you can gauge their brand perception, identify emerging trends, and uncover potential areas for improvement in your own business. Above, we spoke about evaluating your competitors’ strengths and weaknesses. This gives you that data directly from their own customers – straight from the horse’s mouth.
  2. Website Monitoring: Leverage techniques such as web scraping and automated screenshots to monitor your competitors’ websites. At Vaxa, we use perceptual diff technology here – a fancy way to say we can automatically highlight when things have changed on a website day-by-day, and raise that for your review. Competitor changed their wording? Changed their feature image? Changed their price? By capturing and analysing website changes, you can detect shifts in their offerings, pricing, promotions, and messaging and theorise on how they’re adapting to shifting customer behaviour. This real-time intelligence helps you identify their strategic moves and quickly adapt your own approach to market to maintain a competitive edge.
  3. Pricing Monitoring: Stay abreast of pricing trends both locally and internationally by automatically monitoring competitors’ pricing strategies. Track changes in prices, discounts, and promotions to gain insights into their pricing elasticity and competitive positioning. This knowledge enables you to optimise your own pricing strategies, offer competitive pricing, and attract price-sensitive customers.
  4. Advertising Transparency: With tools like Meta Ad Library, you can also gather data on the reach and engagement metrics of competitor ads. They provide a centralised repository where you can search for currently active ads in platform. It allows you to explore the creative elements, messaging, and targeting strategies used by your competitors. By analysing their ad campaigns, you can gain inspiration, understand their positioning, and identify potential gaps or opportunities in your own advertising efforts. This information helps you assess the effectiveness of their campaigns and compare it to your own performance. Ultimately, by studying the ad patterns and trends, you can refine your targeting, messaging, and creative approaches to optimise your advertising efforts and drive better results.
  5. Competitor Benchmarking: Utilise data analytics to benchmark your performance against your competitors across various metrics. Analyse market share, customer satisfaction ratings, online visibility, and other relevant performance indicators to identify areas where you excel or lag behind. This benchmarking exercise guides your decision-making process, allowing you to leverage your strengths and address any weaknesses that may impact your competitiveness.
  6. Industry and Market Analysis: Apply data analytics to analyse industry trends, market reports, and consumer behaviour data. By identifying shifts in consumer preferences, emerging market segments, and potential gaps in the market, you can proactively position your business to capitalise on new opportunities. Data-driven insights provide a solid foundation for strategic decision-making and allow you to navigate the ever-changing competitive landscape effectively.

By starting with a solid foundation and then leveraging the power of data-driven tools, you can build a comprehensive understanding of your competitors, unveil valuable competitive intelligence, and make informed decisions to outperform your rivals.

From monitoring social media to tracking pricing, data analytics equips you with the necessary tools to stay ahead of the competition.

In the upcoming sections, we will explore specific tools, techniques, and best practices to apply data analytics effectively in your quest for competitive intelligence. Prepare to unlock a wealth of knowledge and gain a winning edge over your competitors.

Case Studies and Success Stories

Case studies and success stories serve as valuable sources of inspiration and practical insights when it comes to competitor analysis. Let’s explore a few examples that highlight how businesses have effectively utilised data analytics to gain a competitive edge.

  1. Company X: Leveraging Web Scraping for Competitive Pricing:
    • Company X, a leading e-commerce retailer, faced fierce competition from numerous online retailers in their industry. To stay competitive, they employed web scraping techniques to monitor their competitors’ pricing strategies in real time. By gathering pricing data from competitor websites, they were able to adjust their own pricing strategy, offer competitive prices, and attract price-sensitive customers. This proactive approach helped Company X increase their market share and maintain a competitive edge.
  2. Company Y: Harnessing Social Listening for Product Development:
    • Company Y, a consumer goods manufacturer, wanted to understand how its competitors were perceived by customers in the market. By utilising sentiment analysis and social listening tools, they analysed customer feedback and sentiments presented on social media platforms. This allowed them to identify gaps in the market and consumer pain points that their competitors were not addressing. Armed with these insights, Company Y developed new variations of their products that specifically targeted these unmet needs, resulting in increased customer satisfaction and market share.
  3. Company Z: Competitive Benchmarking for Marketing Strategy:
    • Company Z, a software provider, sought to gain a competitive advantage by analysing its competitors’ marketing efforts. They conducted competitive benchmarking by evaluating their competitors’ online visibility, social media engagement, and content marketing strategies. By benchmarking against their competitors’ performance metrics, Company Z identified areas where they were falling behind and implemented targeted marketing campaigns to bridge the gap. This strategic approach helped them improve brand awareness, attract new customers, and increase their market share.

These hopefully demonstrate the power of a data-driven approach to competitor analysis and how businesses can leverage these insights to drive success. By adopting similar strategies and utilising the right tools and techniques, you too can uncover valuable insights about your competitors and make informed decisions to outperform them.

In closing

Adapting to changing consumer behaviour and outperforming your competitors is essential for business success in today’s dynamic market. By harnessing the power of data analytics and competitor analysis, you can gain valuable insights, identify opportunities, and make informed decisions to stay ahead of the game.

Throughout this blog post, we’ve explored the critical role of data analytics in understanding and monitoring shifting consumer behaviour. We discussed leveraging your own data to gain insights into customer preferences and behaviour, applying competitive intelligence techniques to analyse your rivals, and utilising various tools and techniques for effective competitor analysis. Case studies and success stories have showcased how businesses have harnessed data analytics to gain a competitive edge and achieve success.

Now, armed with knowledge and practical strategies, it’s time to take action.

Start by evaluating your own data, monitoring competitor activities, and leveraging the available tools and techniques. Embrace web scraping, sentiment analysis, social listening, competitive benchmarking, and market research to gather valuable insights about your competitors and your market landscape. Uncover hidden opportunities, refine your strategies, and make data-driven decisions that drive growth and success.

Remember, successful competitor analysis is an ongoing process. Stay vigilant, adapt to changes, and continuously refine your strategies based on the insights gained from data analytics. By embracing the power of data, you can navigate the ever-evolving consumer landscape, outperform your competitors, and position your business for long-term success.


Ready to gain a competitive advantage through data-driven competitor analysis? Discover how Vaxa Analytics can help unlock the full potential of your data and provide you with the insights you need to outperform your rivals. Contact us today for a consultation and let’s propel your business towards success. Wouldn’t you rather be steps ahead of your competition? Let’s make it happen.

An image of two railroad tracks crossing over each other.

Adapting to changing consumer behaviour

It’s no secret that consumer behaviour is shifting. It shifted during and after the pandemic, and it’s moving again as wallets tighten. For businesses, this is undoubtedly a cause for concern – and rightly so. When consumer behaviour changes, it leads to uncertainty in revenue and all the logical flow-on effects. But how does your business grapple with these changes and regain control of its revenue?

The answer lies in understanding two things: how the consumer’s behaviour has changed and how that is impacting your business, and using that to hypothesise the drivers behind the shift. Once those two things are well-understood, the business can begin to correct course by implementing initiatives that directly address these drivers. And the secret to understanding those two things? Your data.

In this blog post, we’ll explore the crucial role of data in deciphering changing consumer behaviour, and provide insights on how your business can more effectively utilise the data it already collects to navigate the shifting tides of consumer behaviour and seize opportunities for growth and success in a difficult market.

Tapping into your own data

We’ve spoken at length about the basics of customer insights and how businesses should be using this information to understand their customers — so if you haven’t given this a read yet, we recommend you do. But the gist of it is, your own data already tells you plenty about your customers.

You just need to take a good hard look at it.

Now, the exact way you analyse this is going to depend on the type of business you run, and your goals/objectives — there’s no getting around that. Generally speaking, there are a few core metrics that will neatly describe the overall health of your relationship with your customers using just basic transactional data that every business has:

  • Frequency: how often are your customers returning to buy from you?
    • A reduction in frequency may mean a few things, including your sales/marketing process becoming less effective, your customers’ wallets tightening, or other issues that mean your purchasing funnel has become more difficult to traverse.
  • Recency: how recently did your customers make a purchase?
    • Even if your frequency metric looks okay, it mightn’t capture the full picture — because some of your customers may be disengaging with your brand. Mapping out the recency of your customers’ purchases can shine a light on this.
    • If you have a large cohort of customers who haven’t purchased in X days, then it’s likely that these people are disengaging from your brand. You should ask yourself why this may be — the driver (informed by the metrics above and below) — and what potential intervening action you can take to remediate the issue.
  • Retention Rate: what percentage of customers continue to engage with your brand over a specific period?
    • Now if you’re a subscription-based business, this is much easier as you can clearly measure when a subscription cancellation happens. You should probably be measuring this as a churn rate (either revenue churn or member churn) — we recommend the formula defined in this post by Recurly.
    • If you’re not a subscription-based business, you’ll need to use a statistical model to describe the retention of your customers. The entertainingly-titled family of models called “Buy ‘Till You Die” are a great example of this. They do require much more custom code to run, so we’ll be posting a guide on this in the coming weeks – stay tuned!
  • Customer Lifetime Value: how much value does each customer generate over their lifetime?
    • Once you have a good grasp on your retention rate, you can form a picture of the lifetime value of each of your customers — are they spending $100 over their lifetime or $1000?
    • This directly speaks to how much you should be spending on your acquisition costs – Cost Per Acquisition must be lower than your lifetime value — but it also directly speaks to your long-term expectation of revenue from your existing customer base. If your LTV-over-time metric is dropping, this usually isn’t a good thing (unless you’re targeting a new/lower-value segment) so you need to establish why it’s dropping. Basically, it’s either your retention is getting worse, or the average transaction value is getting worse (or both) — but the reason for that is something you need more research to make an informed decision. See the section below for more details.
  • Segmentation: categorising your customer base into distinct groups based on various attributes or behaviours.
    • We’ve also spoken a lot about segmentation in the past too, so we won’t spend too much time explaining it again here. The gist of it is, by establishing your key segments, you can overlay the above metrics and form an even better picture of how customer behaviour is shifting. Why is frequency stable overall, dropping for segment X but improving for segment Y? It might be down to changes in your pricing, or perhaps your marketing has shifted more towards targeting segment Y — but you need to see how the numbers stack up before you can make an informed decision.

Looking externally

Your business doesn’t operate in a vacuum, and neither should your analysis. You need to consider external influences on your business and industry to truly understand the shift in consumer behaviour.

You should be monitoring – at a minimum – metrics from the ABS on household spending in your sector. This is new and built off direct access into the bank’s transaction dataset so it’s incredibly accurate and up-to-date. You can access this information here.

You should also investigate what industry research or publications exist that may speak more directly to your challenges — for example, peak bodies often conduct research on behalf of their members. If you’re a member, reach out to your peak body and see what data they may have collected or who they can put you in touch with.

Your competitors are also a useful source of insight. Have they changed tact recently — pricing, promotion, product? That can speak to not only their challenges but potentially how they’ve pivoted to address them. Use that insight to inform how you might address some of your own challenges. Not necessarily by copying, mind you, as there’s no guarantee that their changes will work for your customers.

In some industries, you can also directly get data on your competitors by monitoring inventory levels and the like. There’s a whole field of competitor analytics you can tap into. We’ll be talking more about competitor analytics in a future blog post — so stay tuned for that.

For now, you should also be keeping across industry trends in general. Changing consumer behaviour may also be caused by innovations disrupting your sector — there’s no better example than Uber storming into the market and disrupting taxis. That insight wasn’t sitting in the taxi’s datasets — it was sitting in the industry datasets.

Identifying the drivers of behaviour shifts

Once you’ve established your internal and external views on how consumer behaviour has changed, we need to establish the drivers.

There are a few options to explore here — and you probably will need to do multiple:

  • Surveys: particularly suitable for large datasets. Consider the sample size (you’ll need high hundreds if not thousands to form a good picture), the mechanism (how do people respond) and the incentive (they probably won’t do it for free).
  • Customer interviews: perhaps more effectively, you can speak directly with your customers through an interview. While you won’t get as much rock-solid data, you will gain a deeper understanding of your customer’s behaviours. Don’t be afraid to speak with your customers. It’s critical.
  • Social listening: consumers may be expressing their sentiments through social media platforms and other venues. Off-the-shelf tools can help you listen in on these online communities, or for more bespoke applications we develop solutions to do this for you. In any case, understanding what’s being spoken about here can inform your view of the drivers of the behaviour shift.

Once we have these drivers — the next question is quite obvious: how do we intervene and correct the course of your business?

We’ll be talking about how you can easily devise and implement interventions in our next blog post. Stay subscribed for more details by entering your details below.

The basics of customer insights: leveraging your data for real customer understanding

In today’s competitive business landscape, understanding your customers is key to driving growth and success. Fortunately, with the abundance of data and advanced analytical techniques, businesses can now unlock valuable customer insights like never before. In this article, we will some of the basics around how data and analytics can help you delve into customer behaviour and make informed decisions to optimise your strategies. Let’s dive in!

Segment Composition: Unveiling Customer Diversity

One of the first steps in understanding your customers is segmenting them based on various characteristics. By leveraging data and analytics, you can identify distinct customer segments and tailor your marketing strategies accordingly. Whether it’s demographics, psychographics, or behaviors, segmenting your customer base allows you to personalize your communication, offerings, and experiences. This level of customization can significantly enhance customer satisfaction and drive stronger engagement.

For example, by analysing data such as age, gender, location, and purchase history, you can create targeted campaigns that resonate with specific segments. Understanding the unique needs and preferences of each segment empowers you to deliver personalised messages that truly speak to your customers, ultimately fostering stronger relationships and brand loyalty.

Let’s look at the process involved in delivering an initiative like this:

1 - Identify key customer characteristics
Develop a list of the relevant demographic, psychographic, and behavioral factors that differentiate your customer base. It's ok if this isn't grounded in data yet.
2 - Collect customer data
Gather information such as age, gender, location, purchase history, and any other relevant data points. This might be in your existing systems, or might require new systems. Try to use what you have first for the quick wins.
3 - Analyse the data
Now you'll use your collected data to identify patterns or clusters within your customer segments. This'll likely be on the parameters you identified in Step 1.
4 - Create customer segments
Based on the analysis you've performed, group customers into distinct segments that share similar characteristics or behaviours. You may need tool to help you develop these customer segments, depending on how you plan on targeting them with your efforts (e.g. marketing vs sales).
5 - Refine your efforts
With each segment's unique needs and preferences front of mind, you can trial and iterate on the most effect mechanism to affect outcomes from your customers. This might be different messaging or pricing points, which will resonate better with some segments than others.
Previous slide
Next slide

Retention Rate: Enhancing Customer Loyalty

Customer retention plays a crucial role in sustaining long-term success. Data analysis can help you measure and understand your customer retention rate, providing valuable insights into customer loyalty. It sounds basic – sure- but by analysing patterns and trends in customer behaviour, you can identify factors that influence customer churn and take proactive measures to improve retention.

Through data-driven analysis, you can uncover potential pain points, such as poor customer service or product issues, that might be causing customers to leave. Armed with this knowledge, you can address these concerns promptly, improve your offerings, and enhance the overall customer experience. By focusing on customer retention, you can increase customer lifetime value and establish a strong foundation for sustainable growth.

1 - Define your retention metrics
Determine the key indicators of customer retention for your business, such as repeat purchases, frequency of purchase, subscription renewals, or customer engagement.
2 - Collect relevant data
Gather data on customer behaviour, interactions, and purchase history to track retention metrics. You may need need implement new data gathering systems to assist, or find ways to extract this data from your existing systems.
3 - Analyse the customer behavior
There's many ways to look at retention - many are driven by strong statistical models in the background. Unfortunately, good analytical work here isn't easy -- you might be best off to engage a partner to ensure you're getting the whole picture.
4 - Identify improvement areas
Identify potential pain points or factors that may contribute to customer churn, such as poor customer service, product issues, or lack of engagement. You can do this by looking at which customer segments (which you identified earlier) have lower retention than others -- and ask yourself, why?
5 - Take proactive measures
Address the identified issues promptly, improve your offerings, enhance the customer experience, and implement retention strategies tailored to retain customers and foster loyalty.
Previous slide
Next slide

Customer Lifetime Value: Maximising Customer Potential

Customer lifetime value (CLV) is a metric that helps businesses measure the potential profitability of individual customers over their entire relationship with the company. By leveraging analytical and modelling techniques, you can calculate CLV and segment your customers based on their value (or view the CLV of customers in an existing segment). This allows you to allocate resources effectively, prioritise high-value customers, and tailor your marketing efforts accordingly.

Understanding CLV enables you to identify opportunities for upselling or cross-selling to existing customers. By recognising their purchasing patterns and preferences, you can offer relevant products or services that align with their needs. This personalised approach not only drives additional revenue but also strengthens customer loyalty and advocacy.

1 - Gather customer data
You'll need relevant customer data, including purchase history, transaction values, and ideally customer interactions. Try to get as much history as possible.
2 - Model your CLV
CLV is best served by a statistical model that predicts the true CLV, because you can't actually measure this directly. Your retention metrics from above is one of the key inputs -- so make sure you have a good grasp on your retention before attempting to measure a CLV.
3 - Overlay segments with CLV
You can see which segments have higher CLV or even build segments based on CLV alone.
4 - Use CLV to allocate resourcing
Allocate your marketing and customer service resources based on the value and potential of each customer segment. You may invest more to grow the low-CLV segments, or use the information to invest more in your advertising campaigns, knowing your cost-per-acquisition stacks up.
5 - Take proactive measures
Address the identified issues promptly, improve your offerings, enhance the customer experience, and implement retention strategies tailored to retain customers and foster loyalty.
Previous slide
Next slide

Monetisation Opportunities: Extracting Revenue Potential

Data analysis also uncovers monetisation opportunities within your customer base. By examining customer behaviour, purchase history, and interactions, you can identify potential revenue streams and optimise your strategies accordingly.

For instance, personalised offers or recommendations based on customer preferences and past purchases can significantly increase the likelihood of conversion. By leveraging data and analytics, you can identify cross-selling or upselling opportunities that align with your customers’ needs, thereby driving incremental revenue.

1 - Understand your customer segments
Follow the above steps to form a solid understanding of the behaviour of your customers.
2 - Identify cross-selling and upselling possibilities
Analyse customer preferences, purchase patterns, and complementary product/service offerings to identify cross-selling and upselling opportunities. Are there products that are more commonly bought in one segment and not another? How does price sensitivity vary by segment?
3 - Test, measure, learn
Implement targeted efforts to quantify how your segments respond to up/cross-sell efforts. By measuring the conversion rate on your efforts, you'll also know how much you can invest upfront to still get a net-positive ROI at the end.
Previous slide
Next slide

In today’s data-driven world, understanding your customers is the key to unlocking the full potential of your business. By leveraging data and analytics, you can delve deep into customer behaviour, uncover valuable insights, and make informed decisions to drive growth and enhance customer experiences. With the help of Vaxa Analytics and their expertise in data analysis, you can embark on a journey to unleash the power of customer understanding.

Remember, segmentation allows you to speak directly to your customers, tailoring your offerings to their unique needs and preferences. Retention strategies enable you to build loyal customer relationships that stand the test of time. Customer lifetime value empowers you to prioritise and allocate resources effectively, maximising the potential of your most valuable customers. Monetisation opportunities open up new revenue streams that will make your business flourish.

So, don’t miss out on the opportunity to better understand your customers. Start your data-driven journey today and witness the transformative impact it can have on your business.

Developing your data-driven culture: practical strategies for unconventional industries

Data is increasingly the fuel that powers decision-making; businesses that embrace data find it easier to adapt to changing markets and stay ahead of the curve. However, fostering a data-driven culture isn’t always easy, especially in non-typical industries where the use of data in decision-making isn’t embedded in the culture.

These environments are more numerous than you might think — real estate, fast-moving consumer goods, consumer services, defence industry, just to name a few. But with a lack of strong historical precedence, fostering a data-driven culture in these environments can feel like an insurmountable challenge.

In this blog post, we’ll discuss some practical approaches to jumpstarting this culture in your organisation.

1. Establish business goals and their drivers

Before you can become data-driven, you need to define what you want to achieve. It’s important to highlight — this isn’t what you want to achieve with data. It’s what your organisation wants to achieve as a business.

It’s crucial to set your business objectives and ensure your team thoroughly understand them, and the drivers behind them. If your team doesn’t understand why we need to achieve X, then even with all the data and insights in the world, they might still make poor decisions as they misunderstand the impacts down the chain.

Only once these business goals are set, understood, and embedded can we start to think about how data can assist in achieving those objectives.

It’s also timely to say that, with more data available, it’s entirely likely you’ll revisit what those objectives are. That’s okay. With more data, you’ll be better placed to understand and express the drivers behind your business objectives, and that can unlock entirely new business objectives.

With more data, you’ll be better placed to understand and express the drivers behind your business objectives, and that can unlock entirely new business objectives.

2. Identify and collect relevant data

Once you have defined your goals, you need to identify the data that will help you achieve them. We’ve already spoken at length about how all organisations generate data in the course of their operations, whether they think so or not.

Now we will acknowledge that, in non-typical environments, finding these data sources can be a challenge. But it is there – we just need to think outside the box.

In such environments, it’s important to divorce the concept of “data” from the concept of your “customer”. Some of the most valuable data you have may be entirely unrelated to your customer. While Facebook and Google may collect data on you as a person, the real valuable data is in what you do and how you use their apps. They use that to fine-tune development, forecast future actions, and ultimately tune their business objectives — and the same applies to you.

Think about your data across a few key pillars:

  1. Operational data: This includes data related to the day-to-day operations of a business, such as production rates, inventory levels, and supply chain data. This information can help you identify bottlenecks in your operations, optimise your production processes, and reduce costs.
  2. Financial data: Financial data includes information related to your financial performance, such as revenue, expenses, and profits. This information can help you identify areas where you can cut costs, improve profitability, and make strategic investments.
  3. Employee data: Employee data includes information about your workforce, such as employee turnover rates, employee satisfaction surveys, training compliance and effectiveness, and performance metrics. This information can help you identify areas where they need to improve their employee engagement and retention efforts.
  4. Industry data: Industry data includes information about broader economic and industry trends, such as market share data, industry growth rates, and competitive landscape analysis. This information can help you stay competitive and make informed strategic decisions.
  5. Niche industry data: This includes data specifically generated by your organisation in the course of your business. For example, an organisation delivering property maintenance could collect and use data based on the type of jobs they do, the materials required to complete, the routing/triage of their jobs, and the time taken.

Once you’ve identified your data sources — whether you actively collect them or not — you can start to overlay them with your business processes to identify where they could support decision-making.

3. Overlaying data sources with business process

To start, map out your business processes and highlight where data can be used to optimise your decision-making. This can be game-changing or incremental support.

For example, when ordering stock, you’d certainly be empowered to make a better decision if you had access to forecasted demand levels. When negotiating your electricity and gas contracts, you’d be empowered to make a better decision if you had access to forecast pricing and demand over the contract period.

Ultimately, you’re trying to answer the question: “What could I do better, if only I knew more?”. You should be encouraging your staff to always ask this question of themselves and their work too.

What could I do better, if only I knew more?

Again, it’s important not to get caught up here in the specific mechanism about how that data would get to the appropriate decision maker in the right format — the data management aspect of the solution.

Once you’ve identified these areas where data can be used to support decision-making, you must determine how to integrate the data into your processes. There’s no one size fits all solution here, as it depends on your existing technology, budget, and approach, but there are a few key guiding principles:

  1. Choose solutions that cause the least amount of disruption and require the least training
  2. Remember, your end-users aren’t analysts, nor should they be. The solution will need to provide insights, not just raw data.
  3. Timeliness and trust in data are critical – things that are very hard to correct after the fact.

4. Develop a data-driven culture

Developing a data-driven culture is a critical step towards leveraging data to support decision-making in non-typical environments. However, this can be a significant challenge as decision-making in these environments may be based on intuition or experience, rather than data.

To develop a data-driven culture, it’s important to first educate your employees on the importance of data and how it can help them make better decisions. This can involve training sessions, workshops, and ongoing communication about the value of data-driven decision-making. It’s also important to provide employees with the tools and training they need to access and analyse the data effectively.

It’s crucial to emphasise that data is not there to highlight employee shortcomings or replace them. Rather, it’s about empowering them to make the best decisions possible and to improve overall organisational performance. By providing employees with the necessary tools and training, you can create a culture that values data and uses it to inform decision-making.

Creating a data-driven culture won’t happen overnight. It may be more effective to take a team-by-team approach rather than trying to implement it organisation-wide all at once. Additionally, leadership commitment and buy-in are essential to ensure the success of a data-driven culture. When leadership is committed to the value of data and supports the necessary changes to create a data-driven culture, employees are more likely to adopt these changes and drive positive outcomes.

In terms of specific programs to foster your data-driven culture, several types of support can be made available to employees. These include:

  1. Training: One of the key aspects of developing a data-driven culture is to provide training and education to employees. This can include training on data literacy, how to access and analyse data, and how to use data to make better decisions.
  2. Data governance: Data governance ensures that data is managed effectively, including data quality and security. Establishing a data governance program can help to ensure that data is accurate, timely, and trustworthy. It’s also important for your staff to understand where the data comes from, where it’s made available, and the limitations of that data set for a specific application. We’ve spoken about how to start with data governance as a SME, if of interest.
  3. Access to tools: Access to data analysis tools such as data visualisation software, statistical software, and data analysis platforms is critical to enable employees to access and analyse data effectively — but remember, they’re not there to be analysts, just users.
  4. Analytics support: Organisations can provide analytics support to employees by having dedicated analytics teams or experts who can help employees analyse and interpret data. This can include data scientists, business analysts, or data analysts. They need to have an intimate appreciation and understanding of the business operations to be effective.
  5. Communication and collaboration: Ultimately, like all initiatives in an organisation, effective communication and collaboration with staff are key. This can involve sharing data insights across teams, encouraging cross-functional collaboration, and establishing regular data review meetings.

In conclusion, while data increasingly becomes a crucial component of decision-making across all industries, fostering a data-driven culture is not always easy, particularly in unconventional industries where data may not be embedded in the culture. To develop a data-driven culture, businesses must define their business objectives, identify and collect relevant data, overlay data sources with business processes, and integrate the data into decision-making processes. While developing a data-driven culture is a challenge, it is also an opportunity for businesses to gain a competitive edge, stay ahead of the curve, and achieve new business objectives.

Portrait of a happy business owner hanging an open sign on the door at a cafe and smiling

Getting started with data and analytics as a small business

Starting a small business can be challenging, but with data and analytics, you can make data-driven decisions that will help your business grow. But where do you begin? The idea of data and analytics can be overwhelming, but with the right guidance, it can be a valuable tool for any small business.

Step 1: Identify Your Goals

The first step in getting started with data and analytics is to identify your goals. What do you hope to achieve by using data and analytics? Some common goals include:

  • Improving customer retention
  • Increasing sales
  • Reducing costs
  • Identifying new business opportunities
  • Understanding productivity and efficiency

Once you know what you hope to achieve, you can start to think about how data and analytics can help you reach those goals.

Step 2: Collect and Organise Your Data

The next step in getting started with data and analytics is to collect and organise your data. This may include sales data, customer information, and website analytics. It’s important to ensure that your data is clean, accurate, and up-to-date – things that a data governance approach will address.

To collect your data, you may need to set up tracking systems such as Google Analytics to track website traffic and behaviour. You can also use tools such as a CRM (customer relationship management) system to collect customer information and sales data. Tools like ERP (enterprise resource management) systems manage information on your operations and inventory levels.

Once you have collected your data, it is important to organise it in a way that makes it easy to analyse. With multiple systems, this may include creating a data warehouse or data lake, where you can store and organise all of your data in one place. You may also need to perform data cleaning to ensure that your data is accurate and consistent. Custom data warehouses directly address your need, but turnkey solutions exist for many popular platforms that can provide a good starting point while you up-skill.

Step 3: Analyse Your Data

Now that you have your data organised, you can start to analyse it. This may include looking at sales trends, customer demographics, and website analytics. You can use tools ranging from Excel, Google Analytics, and Amplitude, right through to custom Python code to help you with this step.

When analysing your data, it’s important to keep your goals in mind. For example, if your goal is to increase sales, you may want to focus on analysing sales data and identifying trends or patterns. If your goal is to improve customer retention, you may want to analyse customer data and identify factors that lead to customer churn.

There are a variety of tools and techniques that you can use to analyse your data, such as descriptive statistics, data visualisation, and machine learning. Data analyst specialists – like my team at Vaxa Analytics – can help you with this step and provide you with more advanced analytics techniques like predictive modelling, A/B testing, and customer segmentation.

Step 4: Use Your Data to Make Decisions

Once you have analysed your data, you can use it to make decisions. This may include changes to your marketing strategy, changes to your products or services, buying new equipment, or even hiring new staff.

While these steps may seem simple, they can be challenging to implement on your own while running your core operations. Consider the balance of implementing these steps yourself versus engaging help; we help many small businesses who’d rather focus on their operations to take their first steps and extract value from their data.


In conclusion, data and analytics can be valuable tools for small businesses, but it can be overwhelming to get started. By identifying your goals, collecting and organising your data, analysing it and using the insights to make decisions, a small business can gain a competitive edge. And when the going gets tough, consider engaging an analytics partner to guide you through the process and help you make the most out of your data.

Image depicting a filing cabinet, with the word Vaxa spelled letter-by-letter on the labels of the files.

SMEs and data governance: an approachable guide

Small-medium enterprises are constantly looking for ways to improve their business operations and make data-driven decisions. However, many SMEs struggle with understanding and implementing effective data governance practices – the very practices which underpin all data-driven decisions. In this beginner’s guide, we’ll take a look at what data governance is, why it’s important for SMEs and some best practices for getting started.

What is data governance?

Data governance is the set of policies, procedures, and standards that govern how data is collected, stored and used within an organisation. It ensures that data is accurate, consistent, and compliant with regulations and industry standards. This includes the management of data quality, data security, data privacy, and data lineage.

At Vaxa Analytics, we group data governance under our Data Management offering which, together with Data Strategy and Data Analysis, form the foundations for extracting actionable insights from your data and helping you answer the questions you didn’t even know you should be asking.

Why is data governance important, even for SMEs?

Data governance is essential for SMEs to make sure that their data is accurate, consistent, and compliant with regulations and industry standards. Without effective data governance, SMEs risk making decisions based on inaccurate or unreliable data, which can lead to costly mistakes and negatively impact their bottom line. Additionally, with increasing regulation on privacy and data management, it’s more important than ever for SMEs to have a strong data governance program in place.

Data governance doesn’t get any easy the larger an organisation gets. Indeed, it’s quite the opposite.

Setting solid foundations helps to avoid growing pains in the future. Thankfully, SMEs benefit from their smaller scale, meaning small changes have a relatively large impact on the organisation’s data governance maturity.

Getting started with data governance

An excellent first step in implementing data governance in a small-medium enterprise is to establish clear roles and responsibilities for data governance within the organisation. Assign specific individuals or teams to manage data governance and ensure that everyone within the organisation understands their roles and responsibilities. This is vital as it sets the foundation for effective data governance by ensuring that there is someone accountable for managing data governance within the organisation.

From there, the next logical step is to develop policies and procedures for data collection, storage, and use. This includes auditing your current policies (if any) alongside the data collected from the systems. From there, begin by crafting a data retention policy, data classification policy, data access policy, and data breach response plan. It’s important to physically document these policies (not just assume staff know what to do) because it establishes guidelines and rules for how data should be collected, stored, and used within the organisation, which will ensure that data is accurate, consistent, and compliant with regulations and industry standards. This step also ensures that everyone in the organisation understands and follows the policies and procedures, which will help to minimise the risk of data breaches and other data-related issues.

Now, let’s not kid ourselves – data governance has a wide scope and it isn’t a two-step process! Here are more activities that SMEs should consider — in rough order of priority (and roughly aligned to organisational scale):

  1. Regularly review and update policies: Review and update data governance policies and procedures regularly, such as annually or when regulations change, to ensure that they remain effective and compliant with current regulations and systems in use.
  2. Monitor and measure data quality: Implement processes such as data quality checks, data profiling, and data validation to monitor and measure data quality. Use data quality dashboards and reports to track data quality over time and take action to correct any issues that are identified.
  3. Ensure data security: Implement appropriate security measures such as encryption, access controls, and network security to protect sensitive data from unauthorised access and breaches.
  4. Educate employees: Provide regular training and education to employees on data governance policies, procedures, and best practices, such as data privacy and security awareness training.
  5. Consider getting help: If you’re struggling to implement data governance in your SME, consider engaging a consultant to assist. This is a specialist field, after all. Consultants can help you assess your current data governance practices, identify areas for improvement, and provide guidance on how to implement effective data governance.
  6. Implement automation: Use automation tools to automate data governance processes, such as data masking, data archiving, and data lineage tracking. This will help you to reduce the time spent on manual data governance tasks and increase the accuracy of your data governance.
  7. Implement Data Governance Platform: Implement a Data Governance Platform that will provide a centralised location to manage data governance policies and procedures, monitor data quality, and track compliance.
  8. Establish a Data Governance Council: Establish a Data Governance Council, comprising representatives from different parts of the business, to provide a common forum to discuss and resolve data-related issues and to make decisions on data governance policies. Note that this is more applicable to the larger end of the SME segment.

Cheat sheet for data governance terms

There’s a lot of terminology n the data governance space, and they’ll likely come up in any organisation’s data governance journey. Here’s a quick guide to the most common:

  • Data steward: A person or group responsible for managing and maintaining the quality and accuracy of a specific set of data within an organisation.
  • Data lineage: The ability to trace the origins, history, and movement of data through an organisation’s systems.
  • Data dictionary: A document or system that defines the different data elements and their meanings within an organisation.
  • Data quality: The degree to which data meets the needs of its intended users, is accurate, and is free from errors and inconsistencies, typically assessed under “the 7 data quality dimensions”.
  • Data security: Measures taken to protect data from unauthorised access, use, disclosure, disruption, modification, or destruction.
  • Data privacy: The protection of personal information and sensitive data, including compliance with regulations such as the EU General Data Protection Regulation (GDPR) and Australia’s Privacy Act.
  • Metadata: Data that describes other data, such as data element definitions, data lineage, and data quality rules. Metadata can help classify and categorise data, and therefore help make decisions on the appropriate rules and policies to put in place.

Data governance is essential for small-medium enterprises to make sure that their data is accurate, consistent, and compliant with regulations and industry standards. By following these best practices, SMEs can establish a strong data governance program that will help them make data-driven decisions and stay competitive in today’s business environment.

Analytics isn’t reporting any more

In the not-too-distant past, analytics used to be seen as after-the-fact reporting, dashboarding, charts — understanding what had already happened. Today, analytics is much more tightly coupled with business strategy and product development. It is used to inform and guide decision-making in real-time. 

This shift is due in part to the increasing availability of data. There are now more data sources than ever before, and they are producing more data than ever before. This means data is being generated at an ever-increasing pace, making it difficult for many businesses to keep up, let alone take full advantage of the possibilities that lie at their feet. 

It’s not just the volume of data that has changed, it’s also the quality. Data is now more accurate and timelier, thanks to advances in data collection and processing technologies. This has made it possible to use data to understand not just what has happened in the past, but also what is happening right now and what is expected to happen in the future. 

This shift has had — or, in too many cases, ought to have — a major impact on the way businesses operates. In the past, businesses would make decisions based on their own experience and intuition. Today, they should be increasingly incorporating data-driven insights to guide their decision-making. 

This change has been driven by the need to be more agile and responsive to the ever-changing and competitive market. In the past, businesses could afford to take their time to make decisions. Today, they need to be able to make decisions quickly, based on the latest data. 

This change has also been driven by demands to be more efficient and accurate in investments and use of resources. In the past, businesses would often make decisions based on hunches or guesswork, and there’s a certain “they did the best they could do” asterisk against such decisions that turned out poorly. 

Today, with the high-quality and real-time data available in every business sector globally, a growing expectation is placed on decisions being correct and backed by the data. 

Hopefully it’s becoming clear that organisations need to embrace the capabilities made available to them with modern analytics. However, modern analytics isn’t delivered by simply hiring an analyst; organisations need to consider how their analytics function interweaves with the business as a whole. 

In many cases, analytics can neatly sit alongside both the business strategy and operations teams, forming a vital link between these levels of an organisation. Other times, a business partner approach can work well. In any case, an organisation’s analytics function must be underpinned by investment in systems, processes, and most importantly of all, the business culture. 

Business culture means promoting a data-driven mindset throughout the organisation, from the boardroom to the front line. It means everyone in the organisation understands that data should be used to inform their own decision-making. 

It also means creating an environment where it’s safe to experiment, where failure is seen as a learning opportunity rather than a cause for punishment. And it means having the right people with right skills in place. Communication skills and data literacy are as equally important as technical prowess. 

Consider if an internal analytics function is right for the scale of your organisation. In many cases, analytics isn’t a core business skill, and the investment required to manage this in-house isn’t worth it; good analysts and systems don’t come cheap. Quality analytics-as-a-service offerings can deliver great outcomes while remaining cost-effective. 

Ultimately, there is no one-size-fits-all solution when it comes to utilising analytics into an organisation, but there are some key principles that all organisations should bear in mind: 

  1. Modern analytics deserves to be tightly-coupled with business strategy 
  2. Data can and should be used to inform and guide decision-making in real-time 
  3. Organisations should take advantage of the increasing availability and quality of data 
  4. Move beyond just analysing what’s happened in the past. Instead, look towards the future.